ASO’s Secret Weapon: A/B Testing with Google Play Store Listing Experiments
Testing graphics is a vital piece of the App Store Optimization puzzle in order to ensure your app page’s success. Users consider certain features, characters, colors, and CTAs more important than others, so it is important to know how to attract the right users.
Play Store Listing Experiments is Google’s implementation of A/B testing. Consequently, these terms are interchangeable here.
What is A/B Testing?
You have two versions of Store Listing elements you want to test. Version A – the current version of your store listing (a.k.a. the Control). And Version B – the variant with a change that has been applied to the control.
The test can focus on a variety of aspects of the store listing from short descriptions, videos, icons, and screenshots. The goal is to determine if a specific element within these aspects will help convert views into installs.
The Question Is…
Does the difference in conversions between Version A and Version B occur by chance or because of the changes that have been made?
The Answer? Not So Simple.
Null Hypothesis (a fancy word that statisticians use) is the assumption that the difference you saw in conversions between Version A and Version B occurred by chance.
We don’t want to agree with the Null Hypothesis. We would like to believe that the difference really occurred due to Version B’s changes. In this case, statisticians try to reject the Null Hypothesis and come up with the Alternative Hypothesis.
The Alternative Hypothesis is that the difference in conversions occurred due to our new store listing.
There are two questions we ask when A/B testing:
- Can we reject the Null Hypothesis? Meaning, can we assume that the Null Hypothesis is wrong (that Version B performs better due to our changes)?
- How big is this difference?
A/B Test Statistical Significance
In order to check the first point, we need to know the probability of falsely rejecting the Null Hypothesis, meaning falsely claiming that the boost in conversion is attributable to the new variant we introduced. For this purpose, we need a significance level – the probability of seeing an effect when none actually exists, i.e. the probability we are falsely assuming that Version B performs better because users genuinely prefer it, when in actuality it is due to other factors. This number is usually set to a maximum of 10% in order to not take a higher risk of a wrong conclusion.
In Play Store Experiments, we see a 90% confidence level. That means that the significance level is set to 10% (100% – 10% = 90%). As a result, we say that we are 90% confident that we reject the Null Hypothesis correctly.
The Next Question: How Big is This Difference?
Let’s assume you run a test for 5 days and received the following installs each day from both Version A and Version B:
- Version A – [20, 26, 23, 24, 22]
- Version B – [12, 28, 36, 23, 16]
The average of both versions will be 23, which means we see an average of 23 installs per day. In Version B, we see that the variation from the mean (23) is much bigger than in Version A (there are numbers that have much higher or lower values than the mean).
If we increase the number of days for the test, we will see the following picture:
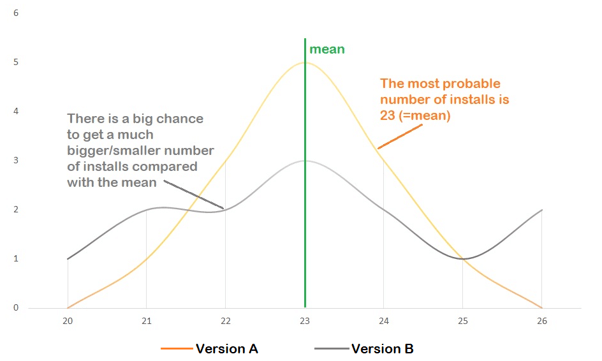
The orange line represents Version A of our test, with which we see the number of installs is usually around 23 (from 19 to 27).
With the purple line, we can see that there is a big chance that the number of installs from Version B will be much greater/smaller than the average (for example, from 14 to 32).
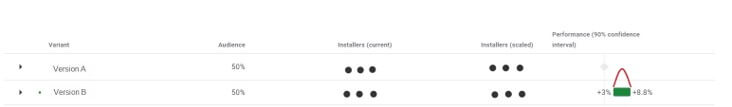
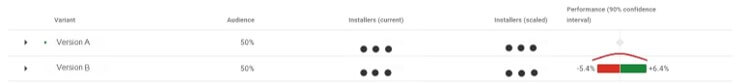
Let’s look into the results of two tests from the Google Play Console:
Now, let’s assume we run these two tests over an equal time period (but not during overlapping periods) and consequently have the same amount of observations (number of days and corresponding number of installations) from each test.
As we can see, the range of prediction in the first test is much smaller than in the second one, and there is a 90% confidence level that we will receive these numbers. The average value of installations will be approximately in the center of these ranges, and it will be the most probable value for Version B in the first test but not in the second one. Since the range of the prediction in the second test is much wider, the probability of receiving the average number of installations will be close to the probability of receiving much higher or lower values of installations. The “prediction” here is the same as the amount of installations we observed in our test (the red-green bar).
There is one significant assumption we should hold if we want to compare these two variants from the two tests – the equal and reasonable amount of days these tests have been running. If we stop an experiment before reaching a reasonable amount of observations, we can receive distributions (the red curves) like in either of the tests but it won’t be close to the true distribution i.e. the true behavior of our users. For example, if we run a test only on the weekend, we won’t know how our average user would react to our new variant (our new store listing), because it is not possible to extrapolate weekday behavior based on weekend behavior.
If you run your test for only a short amount of time, you may see the prediction range as shown in the first picture before, when the true distribution of our installation values (the red curve above red-green bars) can actually look like the distribution in the second test or vice versa.
While we don’t know the distribution of our installation values, we do control the number of days the tests run for. In order to receive reliable results, you will need enough data to analyze.
How to Calculate the Sample Size for Your A/B Test?
Although the results of the test are based on visitors who saw your versions of the store listing and reacted to them, the test does not know the profile of future visitors to your app page. In order to make a test efficient, it should generalize the “average” profile of your users.
You can use the following calculator that shows how many users you need in order to get the results you want from your experiment: https://www.abtasty.com/sample-size-calculator/
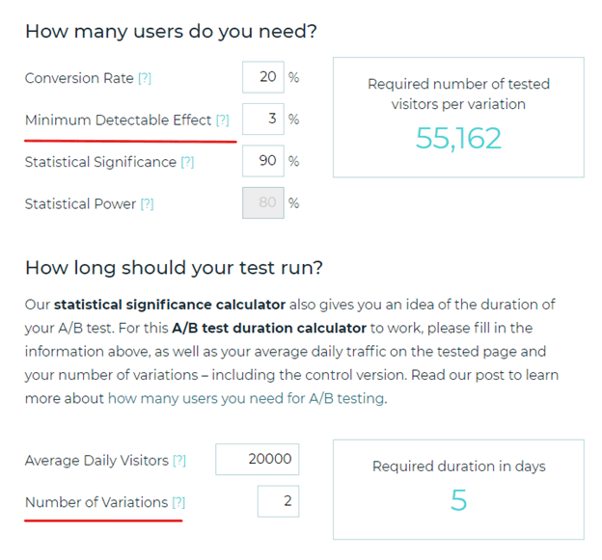
You already know what the A/B test Statistical Significance is. You only need to specify the Minimum Detectable Effect and Number of Variation.
The Minimum Detectable Effect is the relative number of conversions you would like to be able to detect. The smaller the number you insert, the smaller the prediction range you will receive (and that’s good because you want to be able to detect even a slight improvement over your control version). However, detecting minor improvements requires more tested visitors in order to reach an accurate conclusion. The Number of Variations is just the number of versions in the experiment.
There is one more thing you should remember when running Google Play Experiments.
The Play Console divides the audience 50/50, which means that the whole audience is split in half. If you will run another experiment at the same time while running the first one, the results could be unreliable. The reason for this is that your audience could see a few changed store listings for your app and react to them, but you will never find out which store listing version brought you the conversions. Consequently, the interpretation of the Play Store Experiment becomes ambiguous.
GENERAL TIPS:
- Make sure the range of prediction is relatively small
- A smaller range and bigger CVR number gives us a better prediction
- Calculate the duration of your test wisely
- Don’t run multiple tests at the same time
ASO A/B Testing Best Practices:
- Test for at least 7 days, even if you have a winning test after 24 hours. This allows you to analyze all kinds of user behaviors. For example, users have more time to install apps during the weekend, but also uninstall more, so retention may be lower.
- Test your assets twice, even after winning tests. Especially the Icon. Similar to what we said before, users behave differently at the beginning and end of the month. More specifically, around the time they get their paychecks.
- Never apply a test before you have conclusive results for both first-time installers and retained users. Even if it’s almost “all green”.
- Test just ONE variant at a time, divided equally between variants (50/50) to have clear results.
- Don’t just test brand-new assets, but rather come with a strong hypothesis and test one element at a time to learn about users’ preferences and behaviors (this can also help the product).
- Don’t test worldwide. You will be surprised how differently users respond between countries.
- iOS and Android users behave differently, so don’t just apply a winning test on iOS. If you can, test there as well.